Optimize Your Workday® Financial Same Store Reporting

Does your company need to report financial results using Same Store presentation? Are you struggling with how to configure Workday to present different Same Store views efficiently? This article describes some of the challenges and solutions to the Same Store requirement.
Same Store Reporting Overview
The principle behind the Same Store approach is to normalize financial data across periods, removing ‘noise’ such as business units / companies acquired or divested during the comparative time frame, and only present those ‘Stores’ being used as data points in all periods being scrutinized.
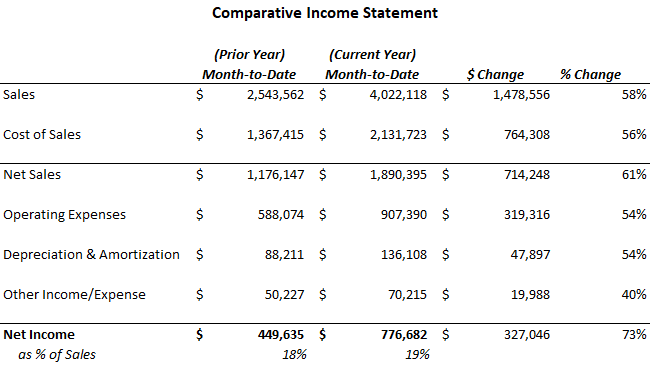
For example, consider the following income statement, which compares this month’s income statement performance against the same month in the prior year:

<figcaption><em>Income statement before “Same Store” principles are applied. </em></figcaption>
This income statement shows HUGE growth and good overall trends…sales are up, net sales margin is higher, and net income as a % of sales is higher by 1 percent. A company might well be happy with these aggregate results. However, a problem is baked into the data: the revenue increase is due to having opened a new location during the current year. (Thus, the sales for that new store are in the current column, but not in the prior.) This means that the comparison is not as meaningful for making a management decision. Though management may well be aware of the “new” store in the data, it would not be proper to assume that the total increase in metrics means that the previously-existing stores are performing optimally just because the company as a whole is.
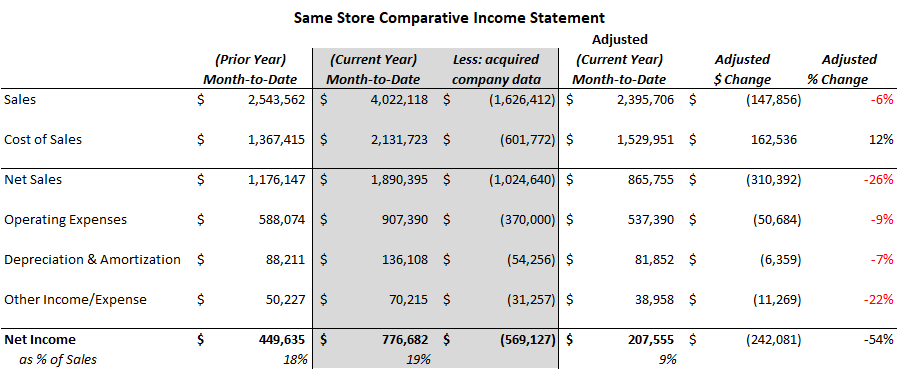
In order to REALLY ascertain comparative performance, it is necessary to remove from the underlying data the Income Statement activity for that new location. This would be considered a Same Store report. Below is the same financial analysis, only with a calculation to remove the new company’s data in the current year. The actual difference on a Same Store basis is starkly different:

<figcaption><em>Income statement after “Same Store” principles are applied.</em></figcaption>
This statement reveals that the stores that existed in this month in both years saw a 6% decline in gross revenue, an increase in operating expenses, and Net Income as % of sales decreased by 50% (from 18% to 9%)! This Same Store reporting can be extremely valuable for management reporting and decision-making, and if you are reading this, likely is already a requirement for your business financial reporting.
The financial statement above is meaningful but can often be difficult to generate directly from an ERP. In the example above, I “knew” of the new store, so I “manually” removed it within Excel … but how to get the Same Store report straight from Workday?
Same Store Approach and Challenges in Workday
One approach has been to add custom fields to your same store object, to add “acquisition date” and “divested date” and use these dates for report filtering in your Same Store reports. (Example: if your focus is on the Company object, add Acquisition Date and Divested Date fields to the Company object, then in your custom reports use a Lookup Related Value to find these dates, and filter out the dates you don’t want.) This approach would require several calculations on every journal line to test if the line company has been acquired or divested, and as a result, has the drawback of taking much time to render. We have seen Same Store reports that run for up to 2 hours, or that cease to render once the YTD number of journal lines reaches a certain level.
This reporting requirement is begging to use Workday’s Hierarchy Effective Dating functionality in a composite report. The hierarchy effective dating leverages Reorganization Dates for filtering data. In theory, one could simply use a company’s hierarchy ‘in and out’ dates to drive the same store report. (Note: this requires that hierarchy changes have meaningful dates, rather than all ins/outs happening on a single date, like implementation date, or 1/1/1900.) This effective dating achieves company filtering that is orders of magnitude faster than calculated field filtering within a custom report.
However, there is a catch here: hierarchy effective dating can only look at a single date. (In this example, the effective dating logic would basically say “only bring in to either column the companies that are in the hierarchy as of the end of the current month, current year”). While this will filter out companies that were divested since the prior year, it would not filter out companies that were added during the current year, since they are in the hierarchy as of the end of the current period. Further, since Same Store reporting is needed on more nuanced time periods, like YTD versus last year YTD, or QTD versus last year QTD, a “beginning hierarchy date” and “ending hierarchy date” are necessary. Several beginning and ending dates, actually!
We have developed a method of intersecting more than one hierarchy with effective dating, and it solves both the cutoff and performance issues. Applying to the comparisons of period-to-period, YTD vs. prior YTD, or CQ vs. prior year CQ, acquired or divested companies fall out/in correctly, and run-time is fast. In one case, a Same Store report containing all 3 of the above metrics was built on the Cost Center object, using the acquisition and divested date custom fields as report filters. The run-time for the report was just under 2 hours in the background, and coming into Q4, the report stopped running entirely due to the data volume. After implementing this hierarchy-based approach, the report runs in 56 seconds, and renders in the UI. It is now possible to use drilling capability to provide even more value to the Same Store report users.
Thank you for taking the time to read this post. I welcome any questions you might have on the optimization of Same Store reporting in Workday.


